Easily monitor data collected weekly, with formatting to highlight missing & notable values.
If you collect data regularly (from a Google form, or perhaps another system) then being able to monitor that data quickly is an indispensable tool to make your task a little easier. The sheet linked below is an ideal place to start, and you can customise it to meet your needs.
Structure
The example sheet itself is split into three tabs. The ‘DATA’ tab contains randomly generated test data), but you can replace this with your own data (or have your form store response data here). The ‘Monitoring’ tab contains information derived completely from the other tab. Finally, the ‘CONFIG’ tab allows you to customise the monitoring sheet without having to update any formulas.
Features
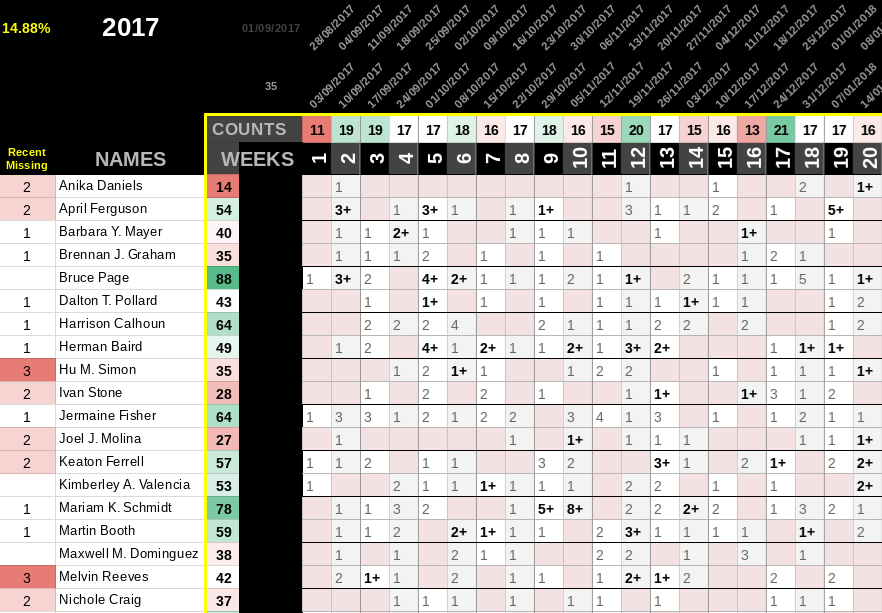
Auto-Populating Headers
The names on the left-hand-side are automatically pulled from the data tab itself. Likewise, the week numbers (and associated start & end dates for these weeks) are also drawn dynamically __ from the data. This saves you the __hassle of having to pre-populate these column headers. You can re-use these monitoring sheets every year, and the dates will stay current. Week numbers starting from the first date in your dataset (e.g. the first week of a school term) are particularly useful for keeping track as the year progresses.
Summary Counts
Each column (week) and row (person) has a summary count, which is also conditionally formatted using a simple scale to give you low (red) and high (green) numbers. These are calculated slightly differently to help you. Imagine you ask each person to fill in their reflections from each week. Most people will do this per-week, but sometimes they might forget, or circumstances may force them to write two in the same week (even though they are reflecting on different weeks). The values in the cells will reflect this (this is a count of how many rows contain their name and fall within the week specified). The row count (to the right of the name) counts the total number of rows for that person (so you can monitor that each person is submitting the correct number of times). The column count counts the number of people who have rows that fall within that week. This should equal a maximum of the total number of people in your data. The count allows you to quickly check that you are receiving the correct number of responses per week. It is not the total responses for the week, as this may be misleadingly high if individuals submitted more that one response/row.
Discriminator Values
The monitoring values also include suffixed discriminators (by default a ‘+’ sign) to indicate that at least one of the values in that week meets the conditions specified in the discriminator query. By default (and by example) this is that the value in the C column of the data must be TRUE and the value in the D column greater than 8. Conditional formatting will pick up this value and highlight it in bold.
Customising
You can easily customise the way in which the monitoring works by editing the values in the CONFIG tab. If your data has the date in column D (rather than the B column in the example data) then just update the ‘Date Column’ value to reflect this. If you would like to update (or remove) the highlighted discriminator values, then you can change this here as well. All the details of each configuration option are provided in this tab.
Happy Monitoring!
Tagged ► Sheet, Google, Example
Related ► Google Calendars on the Web (01 Sep 2018), Protecting Data with Google Drive (14 Aug 2018), Dealing with confidential information in schools (24 Jul 2018)